

Understanding America Across 15 Types of Communities (Part Three)
Our final deep dive into data from the American Communities Project.


Editor’s note: Parts one and two of this analysis are available here and here. For background, “One of the most innovative and insightful organizations I’ve discovered in the past few years is the American Communities Project. For those unfamiliar with ACP, its purpose is to better understand the immense diversity of the United States by breaking down its 3,144 counties1 into 15 ‘community types.’ By collecting a treasure trove of demographic, economic, public opinion, and voting data, ACP gives Americans a deeper look at their country and fellow citizens. As a tribute to the work of the good folks behind this project, I’ll be taking a deeper look at the metrics that shape their community types to help our readers make sense of how Americans in these places live, think, and—true to TLP’s usual analysis—vote.”
Below is Michael’s examination of the final five communities.
Military Posts
Number of counties: 77
Median county population: 96,194
Examples: Leavenworth County, KS; Charles County, MD; Virginia Beach, VA
The defining feature of the 77 Military Post counties (MPs) is the large presence of troops and bases. Mostly situated in rural areas, many of these places are mid-sized, with a median population approaching 100,000. MPs are fairly diverse, with a population that is 65 percent white, 14 percent black, and eight percent Hispanic. Perhaps unsurprisingly, they are also relatively young, as 24 percent of residents are under the age of 18 (more than the national average). This community type also closely mirrors the nation as a whole for college degree rate (31 percent) and median household income ($63,593).
Across a host of health and living standard metrics, MPs do slightly worse than other places, including on obesity, smoking, gun deaths, and access to healthy foods. However, the ubiquity of certain vices is also relatively low in these communities: they have fewer drug overdoses and less excess drinking. Notably, they are home to high-trust populations. More than two-thirds (68 percent) believe that most people can be trusted, the highest level for any area type and 21 points higher than the next-closest. Meanwhile, just 33 percent say “you can’t be too careful,” making them the only place wherein a majority agree with that sentiment.
MPs are generally Republican-leaning. In 2004, a little over a year into the Iraq War, they backed George W. Bush by 23 points, the strongest performance for any GOP nominee this century. Since then, Republicans have won these counties by anywhere from 10 to 16 points, with no clear rightward or leftward trajectory over the long run. In 2024, Donald Trump carried them over Kamala Harris, 55 to 43, the exact same margin by which the AP VoteCast survey shows he won veteran households. Voters here are less likely to vote, with a turnout rate of 64 percent—four points lower than the national average.

Native American Lands
Number of counties: 45
Median county population: 8,124
Examples: Navajo County, AZ; Lewis and Clark County, MT; Cherokee County, OK
Disproportionately located in the American Southwest, Mountain West, and Alaska, Native American lands (NALs) are highly rural and difficult places to live in. For starters, they are extremely poor, with a median household income across these counties of just $47,266, more than $20,000 below the national median. People here are the likeliest to say they have family or a close friend who is less affluent than they are. These places also boast the lowest college-degree attainment rate in the nation—16 percent.
NALs are the youngest of the community types, with an under-18 population of fully 30 percent. One reason for this may be that they have a higher rate of early deaths, lower life expectancy, and smaller 65+ cohort than anywhere else. They also fare the worst on most other key metrics, especially around health, including access to exercise, smoking, drunk driving deaths, food insecurity, disconnected youth, murders, access to healthy foods, suicides, and teen births. There are few bright spots, though their rates of child mortality do appear to be lower than all but two other area types.
In some ways, NALs are very traditional. Faith traditions play a big role for many residents, with three-quarters saying they donate to their religious institution and nearly the same share identifying their faith as important to them. This is also the community type likeliest to favor traditional family structures for success. More than two-thirds also say that owning a gun is a core part of American identity. However, they are also adamantly opposed to cutting government programs, with just 24 percent favoring doing so—tied for the lowest of any type of place.
From 2000 to 2012, NALs leaned Democratic, backing Al Gore in 2000 and Barack Obama in both of his elections. However, since then, they have gone for Trump all three times. In 2024, Trump carried them by the largest margin for any candidate this century: 15 points (57 to 42). However, outside of Arizona and Nevada—two swing states where statewide races are often decided close margins—this population is likely too small to influence election outcomes. This is especially so because their turnout rate of 54 percent is lower than any other community type.

Rural Middle America
Number of counties: 628
Median county population: 28,431
Examples: Dubuque County, IA; Greene County, PA; Fond du Lac County, WI
Rural Middle America (RMA) counties are heavily concentrated in the upper Midwest and Rust Belt. These are some of the least racially diverse places in the country, with a collective white population of 91 percent (tied for first with Aging Farmlands). Their residents also have low levels of formal education—just 22 percent have a college degree—and a slightly lower median income ($61,285) than the national median.
Health outcomes in RMA are often worse than the nation as a whole. They have higher rates of obesity, smoking, and excess drinking and less access to primary care physicians than their peers in other places. Most concerningly, they have by far the highest child mortality rate of any community type. However, it’s not all despair. Like Aging Farmlands, there is a lot of fresh food in these areas, meaning they have lower rates of food insecurity and are less likely to report have no access to healthy eating options.
Residents of RMA are more conservative than many places. They are much less likely to believe that racism is built into the country, people should be “free to express their gender identity,” and the U.S. would be better off with more immigration. They are also likelier to say that conservative beliefs are disrespected, and nearly two-thirds agree that “experts don’t understand me,” more than the national average. In addition, fully 80 percent believe America is in decline—the second-highest rate.
RMA is among the more Republican-leaning community types, though less so than some others. These types of counties are often ancestrally Democratic and where residents may even still register as such—but it has been eons since they voted for the party. Since 2000, the worst any Republican has fared in them was John McCain, who carried them by ten points over Obama, 54 to 44. After Romney increased that margin to 18 in 2012, Trump nearly doubled that, winning them over Hillary Clinton by 34 points. He basically held steady in 2020 and then expanded that margin to 37 last year. Voter turnout in RMA mirrors the national average of 68 percent.

Urban Suburbs
Number of counties: 112
Median county population: 542,410
Examples: San Mateo County, CA; Nassau County, NY; Collin County, TX
The populous counties that abut the nation’s big cities—Urban Suburbs—are overall the best-educated and wealthiest places in the country. More than four-in-ten residents (42 percent) have a college degree, and the median household income is $87,692. They are also the most diverse majority-white community type, with a population that is 11 percent black, 16 percent Hispanic, and six percent Asian.
These suburban areas have some of the best outcomes for health and living. Fully 95.4 percent of residents have ample access to exercise options, only 14 percent smoke, and the obesity rate (30 percent) is the lowest of any community type. They tie Exurbs for the lowest child poverty rate, levels of food insecurity, and self reports of having “poor or fair health.” These areas have by far the fewest gun deaths of any place (just eight per 100,000), the highest levels of flu shots, and ample access to primary care physicians. At 80 years of age, life expectancy is higher here than anywhere else.
Given the picture painted above, it may not be surprising to learn that these counties tend to be quite liberal. They trail only Big Cities in support for abortion rights and the belief that people should express whatever “gender identity” they prefer. Urban Suburb residents feel very connected to their country. They are less likely than most places to say that “experts don’t understand me,” fear they aren’t represented in pop culture, or believe that America is in decline. Religion and faith are much less important as well, and few (just 34 percent) think the right to own firearms is a core part of what it means to be American.
However, despite their liberal lean, these places are not overwhelmingly Democratic. Since 2008, they have voted Democratic by an average of 16 points. Notably, though: after Joe Biden hit a high point of 20 in 2020, Harris only won them by 14, a six-point drop and nearly half her margin in Big Cities (26 points). Their relative diversity and high share of college-educated residents signal they should continue drifting leftward over time, but the 2024 results indicated that may not be a given. The good news for Democrats is that voters here are highly engaged, turning out at a rate of 74 percent—tied with the Exurbs for the highest among all communities.

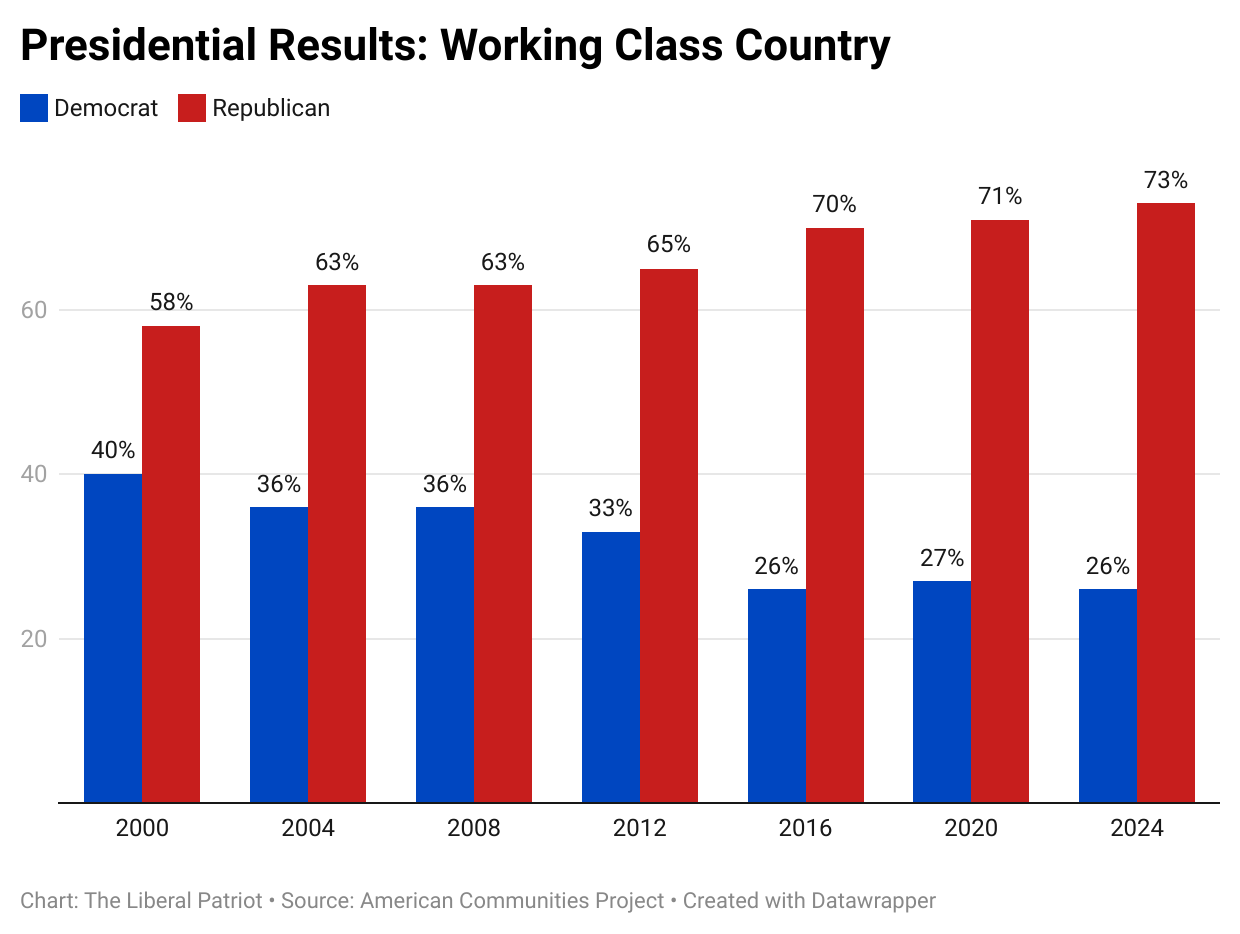
Working Class Country
Number of counties: 280
Median county population: 23,628
Examples: Pope County, AR; Grant County, IN; Kanawha County, WV
The communities in Working Class Country (WCC) tend to be quite rural, centering on small towns in places like Appalachia, the Ozarks, and the upper Midwest. As the moniker suggests, residents of these areas are are decidedly working-class: just 19 percent have a college degree, and the median household income is $51,322. The overall population is somewhat racially diverse: 76 percent white, eight percent black, and four percent Hispanic.
Health outcomes in these places are generally poor. People here are likelier to be uninsured, have less access to a primary care physician, and report being in poor health. They are also more food insecure than the national average. However, residents are less likely to be negatively impacted by drugs and alcohol, and the child mortality rate is lower than anywhere else.
People in WCC are very conservative and among the likeliest to be surrounded mostly by like-minded people. Just 37 percent agree that people should express the “gender identity” of their choice, less than one-quarter (24 percent) say most people can be trusted, and a paltry eight percent think the country would benefit from letting in more immigrants, lower than in any other place. They care about faith and family and generally feel like they are becoming untethered from their country.
These conservative attitudes and beliefs are reflected in WCC’s voting tendencies. Since 2000, voters here have become progressively more Republican-leaning. The biggest rightward shift came between 2012, when Romney won them by 32 points, to 2016, when Trump carried them by 44. In each of his subsequent races, Trump has matched that exact margin, making WCC the third-most Republican-leaning type of community behind Aging Farmlands and Evangelical Hubs. Voters here are less likely than the nation as a whole to vote, turning out at a rate of 61 percent.
An outstanding study. As a country we are most certainly diverse. The key question for me is: How should these data be used to get Dem leaders off their asses and develop a coherent and compelling set of actionable positions ie economy, immigration, etc to get back in power?
Native American Lands and Urban Suburbs are perhaps the clearest cases among the communities of culture trumping policy. Urban Suburbs like their leftist social policies even at the cost of high tax burdens. NAL on the other hand oppose government cuts but vote R because of guns and faith