

Understanding America Across 15 Types of Communities (Part Two)
Continuing our deep dive into data from the American Communities Project.


Editor’s note: Part one of this analysis is available here. For background, “One of the most innovative and insightful organizations I’ve discovered in the past few years is the American Communities Project. For those unfamiliar with ACP, its purpose is to better understand the immense diversity of the United States by breaking down its 3,144 counties1 into 15 ‘community types.’ By collecting a treasure trove of demographic, economic, public opinion, and voting data, ACP gives Americans a deeper look at their country and fellow citizens. As a tribute to the work of the good folks behind this project, I’ll be taking a deeper look at the metrics that shape their community types to help our readers make sense of how Americans in these places live, think, and—true to TLP’s usual analysis—vote.”
Below is Michael’s examination of the second five communities, with part three to come next week.
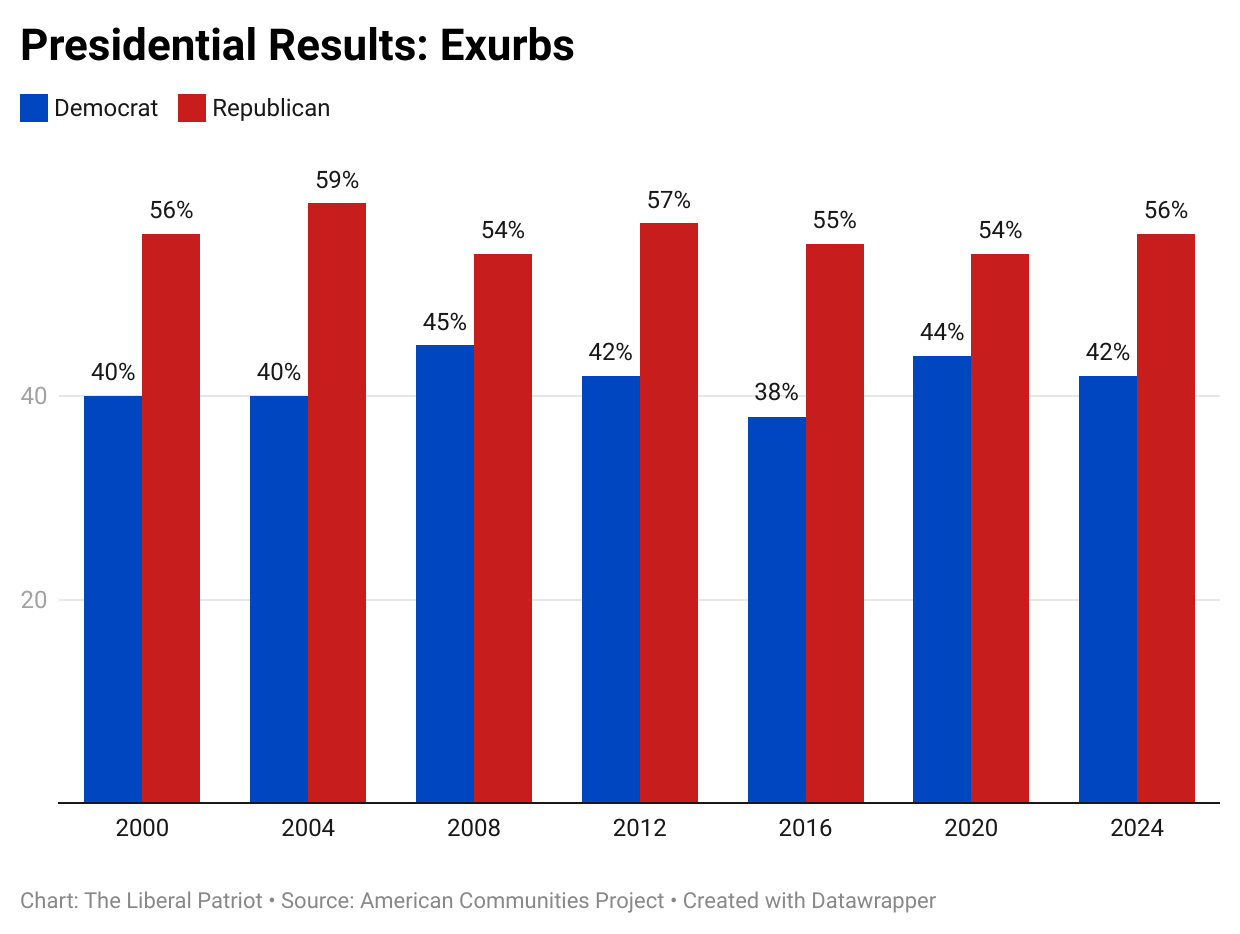
Exurbs
Number of counties: 196
Median county population: 109,220
Examples: Larimer County, CO; St. Charles County, MO; Waukesha County, WI
Exurban communities are situated on the edges of major metropolitan areas. Though the city sprawl extends to these counties, making the exurbs slightly larger than the many other communities, they often bleed into more rural and less densely populated land. Further away from city cores, these places tend to be less racially diverse (78 percent white) and wealthier (median household income of $80,286, second-highest of any community type) than the national average.
Life in the exurbs is pretty good across a host of metrics, especially for kids. These places have the second-lowest child mortality rate, are tied with other communities for the lowest rates of child poverty and infant deaths, and have relatively low rates of school segregation, juvenile arrests, and disconnected youth. Health outcomes are excellent here, too: these areas have the lowest levels of food insecurity and drug overdoses and are among the communities whose residents are least likely to say they are only in fair or poor health. They also have some of the lowest levels of STDs and uninsured populations and higher rates of flu vaccinations than the national average.
The biggest challenges of living in exurban areas stem from a more spread out population: people are likelier than most other places to have long, solo commutes to work and less immediate access to healthcare (specifically, to primary care).
In general, these communities lean more conservative, though not always. Residents of exurban counties are likelier to say that that “experts don’t understand me” (52 percent) and among the least likely to believe that racism is baked into American life (40 percent). However, they surprise in other ways. Fully two-thirds say that abortion should be a woman’s choice, and 70 percent believe the economy is rigged to favor the wealthy. They’re also less likely to say that their faith is important to them (just 51 percent).
This overall conservative lean is reflected in the exurbs’ voting habits. Since 2000, Republican presidential nominees have consistently won these places by between 10 and 20 points. The one exception was 2008, when Barack Obama cut John McCain’s edge here to just nine points. The exurbs have not clearly trended more blue or red during that time, though they did swing seven points more Democratic in 2020—going from R+17 to R+10—before shifting back in 2024 to a 14-point advantage for President Trump. And, notably, voters here are among the likeliest to vote, turning out at an astounding rate of 74 percent—tied for first among all community types.
Graying America
Number of counties: 396
Median county population: 18,557
Examples: Gila County, AZ; Sumter County, FL; Carroll County, NH
As the name implies, the defining feature of Graying America (GA) communities is their age: more than one-quarter (26 percent) of residents are 65 years of age or older, a greater share than in any other community type. They also tend to be very racially homogenous (85 percent white), more rural, less populated, and lower-income. These primary distinction between GA and the Aging Farmlands we examined in the previous piece is that the latter were almost all located in the Great Plains region—an area with more farmland—while GA counties are spread across the country, with concentrations in New England, Florida, the upper Midwest, and the West.
Overall, the metrics for GA counties are worse than the national average, much of which relate to health and isolation. Given the small size and rural nature of many of these communities, it is harder to access quality healthcare. The ratio of residents to primary care physicians is greater here than many other places, as is the percent of the population reporting being in only “fair or poor health.” Additionally, the rate of suicide is quite high in GA counties, as are rates of excess drinking. One bright spot, however: murder rates are very low here.
People in GA are fairly conservative, though, as in the exurbs, there are some interesting exceptions. They are likelier to believe that the U.S. is in decline, less trusting of others, and less likely to believe the country would be better off if it let in more immigrants (just 20 percent agreed). And yet, 70 percent also believe in a woman’s right to choose, 73 percent agree that the economy is rigged to favor the rich, and only a quarter say they government should cut services and lower taxes—undoubtedly due to support for programs like Medicare and Social Security.
Despite this eclectic mix of beliefs, GA communities are quite Republican-leaning and have only grown more so over the past few elections. After these counties went for Mitt Romney by 10 points, Trump doubled that performance four years later, winning them by 20. They swung slightly back toward Democrats in 2020, breaking for Trump by 17, but then he hit a high point for Republicans this century, winning here by 24 points in 2024. Voters in GA also vote at high levels, with a turnout rate of 73 percent.

Hispanic Centers
Number of counties: 178
Median county population: 18,383
Examples: Imperial County, CA; Pueblo County, CO; El Paso County, TX
Home to some of the largest clusters of Hispanic residents in the country, Hispanic Centers (HCs) are most present in the American Southwest and California, especially along the U.S.-Mexico border. There is a lot of variation among the counties that make up this community type. For instance, Hispanics are slightly less than a majority of the population in some counties while they make up nearly all residents in others. Additionally, some of these places cover large urban areas (like El Paso or Miami) while others are small and rural (like several in the Rio Grande Valley).
But there are important similarities, too: these populations are heavily working-class. Across this community type, just 20 percent possess a college degree, and the median household income is only $51,608—more than $18,000 under the national median.
One hallmark of HCs is the ubiquity of poor health. People in these areas fall below national averages on a host of measures, including: adequate access to locations for exercise, obesity, rates of smoking, rates of flu shots, levels of food insecurity, access to primary care physicians, teen births. They are also much likelier to reporting being in poor or fair health. HCs have the largest uninsured population at 20 percent—double the national rate. Despite this, these communities do well on two other metrics: they are tied for the lowest rate of drug overdoses and have among the lowest levels of excess drinking (and, thus, fewer drunk driving deaths as well).
HCs are somewhat culturally conservative. People here are less likely to believe that it’s “hard to get ahead in America” (37 percent), the economy is rigged in favor of the rich (62 percent, the lowest of any place), or America is in decline (61 percent, also the lowest rate). They are also slightly less likely than the national average to support a woman’s right to choose, though fully 64 percent still do. They are the likeliest group to say that immigration is the most important issue facing their communities, but just 17 percent believe that America would be better off if it allowed more immigrants in.
Overall, HCs are a quite competitive electorally. In fact, presidential results here have more closely tracked the final outcome nationally than in any other place since 2000. HC counties have voted for the national popular vote winner all but once (2000) and the Electoral College winner all but once, too (2016). Democrats narrowly carried this community type from 2008 to 2020. But in 2024, it went for Trump by eight points—the second-largest margin for either party this century. When it comes to actually showing up, though, voters in HCs are less active, with the second-lowest turnout rate (57 percent).

LDS Enclaves
Number of counties: 39
Median county population: 21,906
Examples: Bonneville County, ID; Salt Lake County, UT
LDS enclaves (LDSEs) are located entirely within the states of Utah and Idaho, and it’s the only community type whose counties are all contiguous. In Utah, specifically, all but one county is an LDSE. Most of these places are rural and racially homogenous, but one notable distinction with others is their relative youth: fully 28 percent of residents are under the age of 18, the second-highest of any area type. They are slightly more educated than the country as a whole (35 percent bachelor-degree completion) and slightly less wealthy (a median income of $63,576).
The health and life outcomes of LDSEs tell a complicated—and sometimes even contradictory—story. They have the lowest rates of smoking, excess drinking, murders, and infant deaths and among the lowest rates of obesity, early deaths, child mortality, and child poverty. At the same time, they have more juvenile arrests than any other place, higher rates of suicides, and inadequate access to primary care physicians. They also have by far the highest rates of segregation between black and white students.
In some, perhaps expected ways, LDSEs are relatively conservative. Fewer residents here than anywhere else believe women should have the right to choose an abortion (though it’s still a slight majority at 53 percent). They are likelier than people in other areas to believe that conservative beliefs are disrespected and that traditional family structures are important. But in other ways, they are a bit more progressive-minded, as one of the groups most likely to believe more immigration is good for the U.S. They also tend to be more civically engaged and optimistic. LDSE residents are likelier than those anywhere else to volunteer for either their church or for a non-religious charity, and a massive 81 percent think Americans have more in common than believed—far higher than in any other place.
Interestingly, LDSEs were among the most Republican-voting places at the beginning of this century. In 2000, 2004, and 2012, they voted more heavily for the GOP presidential nominee than people living anywhere else. However, that support has declined since Trump took over the party. After backing Romney by 49 points, their support for Trump more than halved in 2016, dropping to just 21 points. Though Trump has bounced back some since then, his gains have been muted, and his levels of support are still lower here than for the four preceding Republican nominees. LDSE residents are also a higher-propensity group, with a turnout rate of 72 percent.

Middle Suburbs
Number of counties: 57
Median county population: 176,511
Examples: Genesee County, MI; Lorain County, OH; Luzerne County, PA
Located primarily in Rust Belt states, Middle Suburbs are among the largest community types by median population, trailing only Big Cities and their immediate suburbs. They embody the exact type of communities throughout the Midwest that have historically voted Democratic but swung to Trump in 2016—and often haven’t swung back. They are 83 percent white and very working class, with just 27 percent of residents holding a college degree and a median income below the national average ($64,593).
Outcomes in Middle Suburbs are mixed. Life for young people is generally quite good: these places have lower rates of child mortality and disconnected youths. Additionally, murders and juvenile arrests are both below the national average, while the uninsured rate is just eight percent, tied for the lowest. At the same time, these places experience far higher rates of drug overdoses than any other community type and have higher rates of excess drinking, smoking, and obesity than at the national level. Life expectancy is also slightly lower here.
People in Middle Suburbs seem more disconnected from the country than those in other areas. Less than half (43 percent) say that they feel represented in pop culture, while just 30 percent believe people can generally be trusted. They are likelier than many others to say that America is in decline. They are also among the least likely groups to volunteer at a church or religious center (though slightly more likely than the average to volunteer for a non-religious charity). On social issues, people here generally don’t lean too strongly to the left or right.
However, the direction of Middle Suburbs’ voting habits is clear: they have become more Republican since Trump first arrived on the scene in 2016. From 2000 to 2012, these places backed the winner of the national popular vote every time. In that final contest, Obama narrowly carried them by one point. But four years later, they swung hard to Trump, breaking for him by 13 points. After a slight reversion in 2020, they went for him again by an even wider, 15-point margin in 2024. Voters in these counties turn out at about the same rate (69 percent) as the national average (68).

I am really enjoying this series. Very interesting, thank you!
I find this sort of thing so facinating! I enjoyed the first two so much I subscribed as I want to comment here! However Saint. Louis County is actually not an Exurb but an Urban Suburb! I am guesing you confused it with Neighboring St. Charles or Jefferson Counties, which are classified as Exurbs in American Communities.
One additional thing to note about exurban counties is that while relatively affluant on average, home values are also lower then in most urban suburbs and most Exurb residents actually lack college degrees. Many manufacturing plants and warehouse facilities have moved to the exurbs in recent decades, while many (disproportionatally well off) working to lower middle class residents have moved there from inner suburbs in particular in recent decades.
Finally, Exurbs in The American Communities project aren't just true exurbs, but also many smaller isolated metropolitan areas or large micropolitan areas with similer demographic and social chericteristics as most true exurban counties. There are also many counties in many other community types such as Graying America, African American South, Working Class Country, Hispanic Centers, etc etc that are also exurban in terms of density, location and economic function for larger metro areas as well.